Underbook data · September 22, 2026
One afternoon, 426 hotels, 25 cities, the same two-night stay in October 2026, every booking site Google Hotels lists. Here is how often a cheaper listing exists, how much cheaper it is, who has it, and the one caveat that decides whether it is a real saving.
Correction, September 23, 2026
The first version of this page called 45 of these listings "confirmed same-room savings". The matcher behind that label only checked that the cheaper site named a room, not that the room matched the one other sites were pricing, and a spot-check found shared-dorm beds among them. We now describe the 45 as what they are: cheapest listings that named a room. The matcher in the Underbook extension was fixed the same day (it now compares room names), and a second snapshot will report a true same-room figure. Every other number on this page is unchanged.
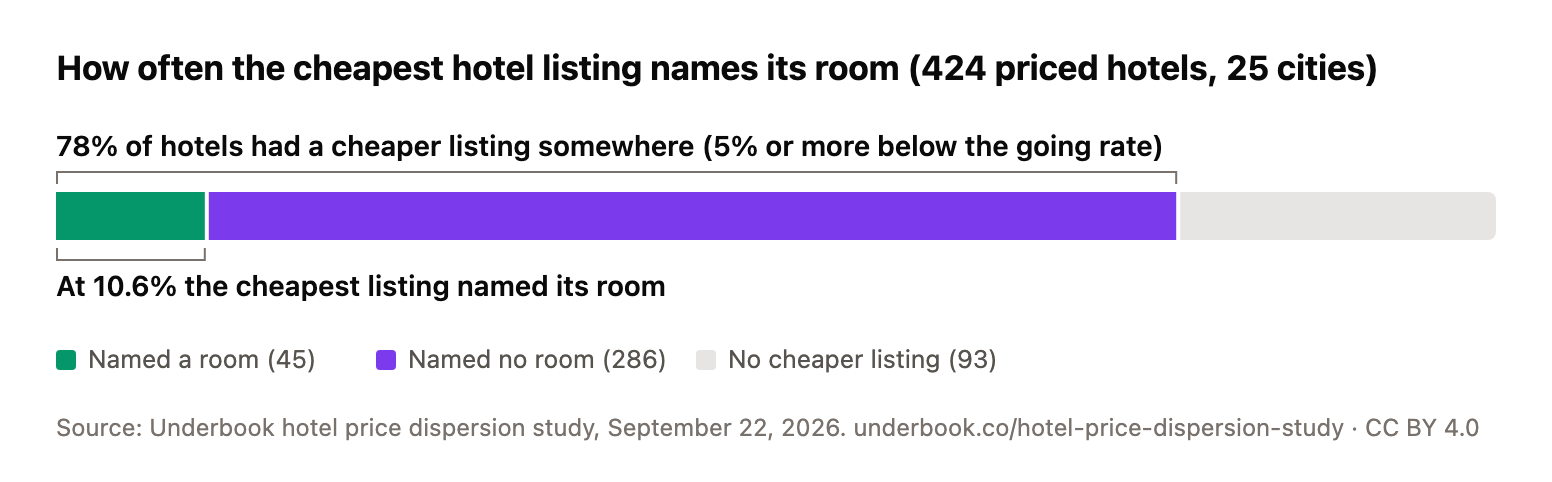
For 331 of 424 hotels that had prices, some booking site listed the stay at least 5% under the rate most sites agree on. The typical gap was 19%, about $28 a night. That part of "the same hotel costs less somewhere else" is simply true.
The catch is what the cheaper listing is for. At 286 of those 331 hotels the cheapest listing named no room at all: the site publishes a price, not which room it buys. At only 45 of 424 (10.6%) did the cheapest listing name a room, and naming a room is not the same as being the same room: in a spot-check, some were a bed in a shared dorm priced against private rooms. They can still be real bargains. You just cannot know from the price alone, which is why our extension says "check the room" unless the room names match.
One more honesty number: for 31% of hotels, no site reported a before-tax rate at all, so the "all-in" price on screen may be missing resort or property fees. We flag those too.
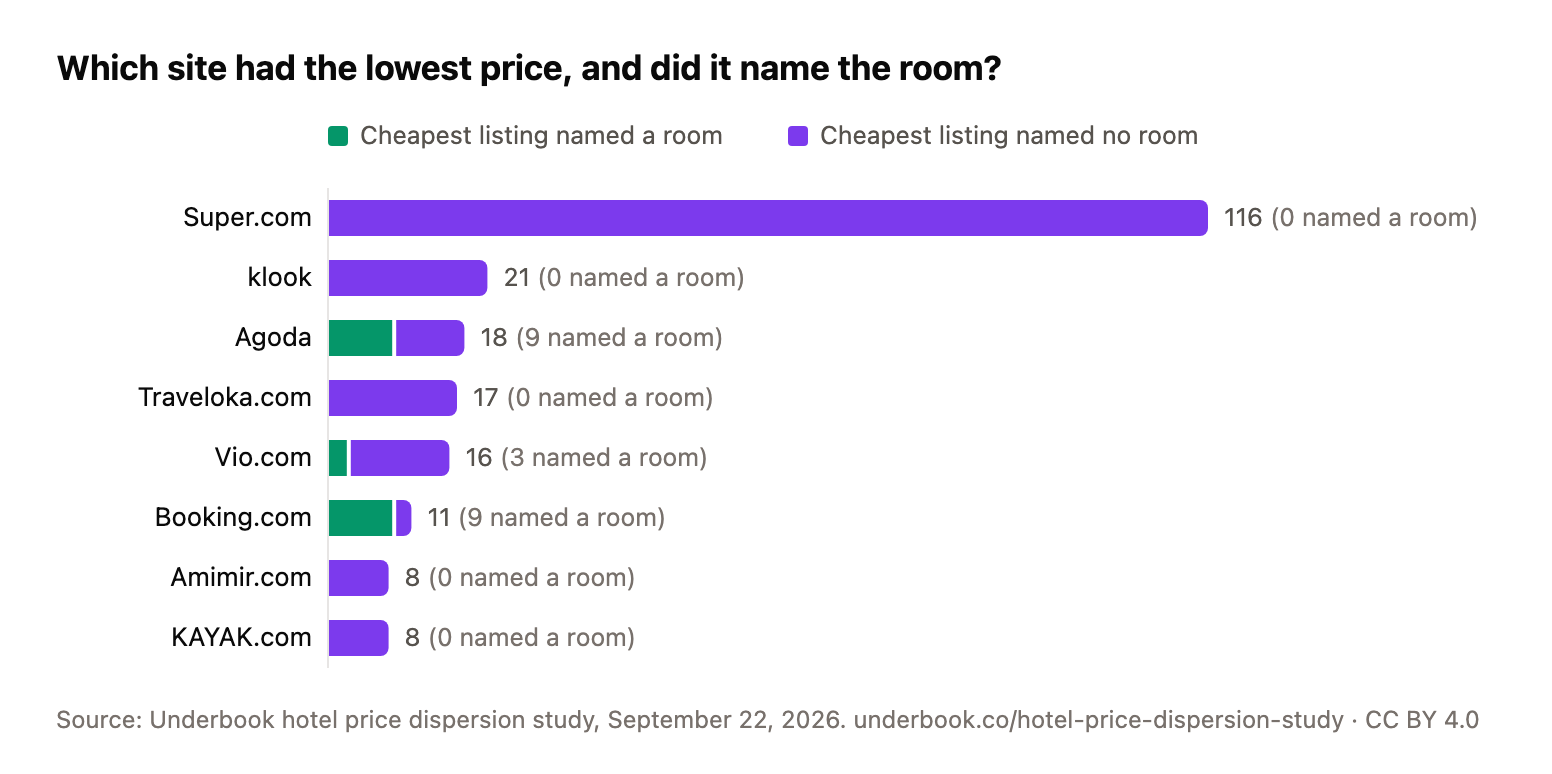
Of the 331 hotels where a site undercut the going rate by 5% or more, this is who had the lowest price, how much lower it typically was, and how often that lowest price named a room.
| Site | Cheapest at | Typical discount | Named a room |
|---|---|---|---|
| Super.com | 116 | 20% | 0 |
| klook | 21 | 17% | 0 |
| Agoda | 18 | 19% | 9 |
| Traveloka.com | 17 | 18% | 0 |
| Vio.com | 16 | 19% | 3 |
| Booking.com | 11 | 37% | 9 |
| Amimir.com | 8 | 13% | 0 |
| KAYAK.com | 8 | 22% | 0 |
| Traveluro | 8 | 28% | 0 |
| Hotels.com | 7 | 11% | 7 |
| Evendo | 6 | 24% | 0 |
| Billabook.com | 5 | 17% | 0 |
Super.com was cheapest at 116 hotels and named a room at 0 of them: the wholesaler pattern, a rate with no room attached. When Booking.com or Agoda were cheapest, about half the time they named the room. That difference is the reason a "20% off" rate deserves a second look before you enter a card number.
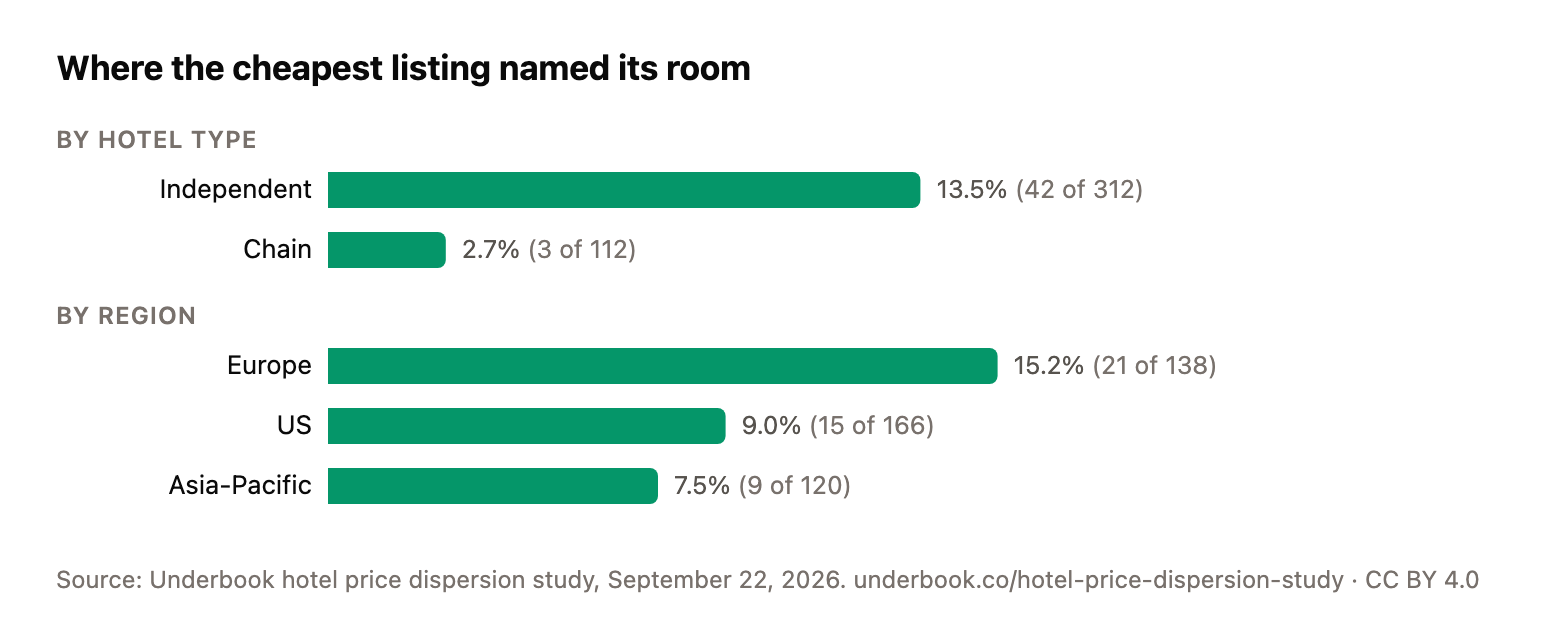
We expected chains to be where the cheaper listing names its room, because chains publish room names everywhere. The data says the opposite. Chain hotels had a cheaper listing 82% of the time, but the cheapest listing named a room only 2.7% of the time; independents 77% and 13.5%. The likely reason: chains hold their sites to rate parity, so the only "cheaper" listings are wholesalers that publish a rate and no room; independents lean on Booking.com, Agoda and hostel sites, which carry room names (for hostels, often a dorm bed).
By region, a cheapest listing that named its room was most common in Europe (15.2% of hotels), then the US (9.0%), then Asia-Pacific (7.5%). A cheaper listing of some kind existed in 84% of US hotels, 82% in Asia-Pacific and 67% in Europe.
| Segment | Hotels | Cheaper listing | Named a room |
|---|---|---|---|
| chain | 112 | 82% | 2.7% |
| independent | 312 | 77% | 13.5% |
| Region | Hotels | Cheaper listing | Named a room |
|---|---|---|---|
| APAC | 120 | 82% | 7.5% |
| EU | 138 | 67% | 15.2% |
| US | 166 | 84% | 9.0% |
| City | Hotels | Cheaper listing | Named a room |
|---|---|---|---|
| Honolulu | 18 | 100% | 5.6% |
| Miami | 18 | 94% | 11.1% |
| Los Angeles | 17 | 94% | 11.8% |
| Las Vegas | 15 | 93% | 6.7% |
| London | 18 | 89% | 11.1% |
| Orlando | 18 | 89% | 5.6% |
| Seoul | 17 | 88% | 11.8% |
| Singapore | 17 | 88% | 5.9% |
| Bali | 16 | 88% | 0.0% |
| Chicago | 15 | 87% | 6.7% |
| Barcelona | 18 | 83% | 22.2% |
| Dubai | 18 | 83% | 11.1% |
| Sydney | 18 | 83% | 22.2% |
| Bangkok | 17 | 82% | 0.0% |
| Nashville | 17 | 76% | 5.9% |
| Vienna | 17 | 76% | 11.8% |
| Austin | 15 | 73% | 6.7% |
| Lisbon | 15 | 67% | 6.7% |
| New York | 18 | 67% | 11.1% |
| Paris | 18 | 67% | 22.2% |
| San Francisco | 15 | 67% | 20.0% |
| Tokyo | 17 | 65% | 0.0% |
| Berlin | 18 | 61% | 11.1% |
| Rome | 16 | 56% | 25.0% |
| Amsterdam | 18 | 33% | 11.1% |
A free Chrome extension. It shows the going rate, the cheapest listing, whether that listing is the same room (it compares the room names, and says "check the room" when they do not match), whether fees are verified, and lets you watch the price.
Underbook, "We priced 426 hotels in 25 cities" (hotel price dispersion study, September 22, 2026), https://underbook.co/hotel-price-dispersion-study
The charts and the data are free to reuse under CC BY 4.0 with a link back. Chart images: the headline split, who is cheapest, where the cheapest listing named its room. Journalists who want a per-city or per-site cut: hi@underbook.co.